The Data Display is commonly used inside the
VIRGO collaboration for interactive viewing of frames online (via the network)
or offline (in files). The display is done inside a ROOT canvas, so it was
natural to incorporate the Data Display functionalities inside VEGA. A user is
then able to view some data, then process the graphical result via a
script.
For a detailed explanation of the Data
Display use, the reader is invited to look at the Data Display user’s
manual. We will focus here on the interaction with VEGA.
IX.2 The
Data Display inside VEGA
Displaying data interactively using the Data
Display may be done inside VEGA in two ways:
use the command
dataDisplay(): vega[]
dataDisplay() This will launch the
usual Data Display
launch the data display on a frame channel
previously opened.
IX.2.1 Displaying
data from a frame channel source
The frame channel is the main data providing
mean in the VEGA "philosophy". It is thus natural to be able to view data coming
from a frame channel inside the Data Display. If "fc" is an already opened frame
channel, this is done by the command:
vega[] fc->StartViewer()
The Data Display will be opened with the
main browser window showing the channels inside frames from the frame
channel.
IX.2.2 Interaction
with the produced plots
Once the user has made the desired plots, he
is able to interact with these plots from inside VEGA. A global variable named
gDataViewer represents the data display. One can interact with it with the
following methods :
gDataViewer->GetPlot(i)
will return a TObject* corresponding to the
plot in the pad n° i. This object should be casted to a TH1F* or a TH2F*
depending on the type of the plot in the corresponding pad, like in
:
vega[] h1 =
(TH1F*)gDataViewer->GetPlot(3)
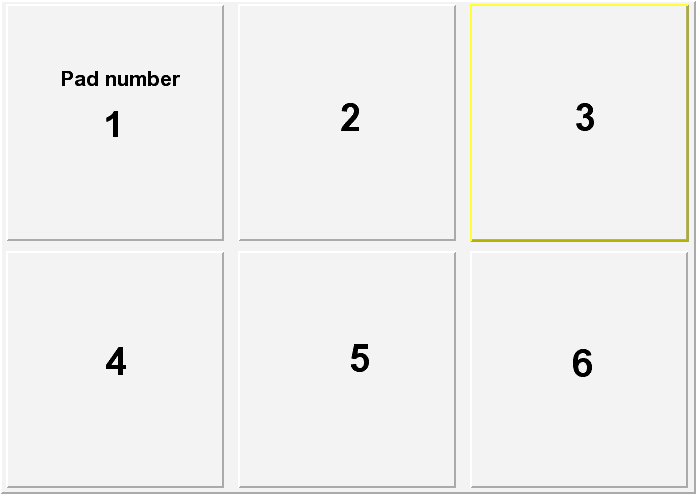
Reminder : the pads are numbered from up to
down and left to right, like in :
The canvas created by the data display is
called gDDCanvas and is accessible globally after its creation. One can for
example put the y scale of the pad number 2 in log with the
commands:
vega[] gDDCanvas->cd(2)
vega[] gPad->SetLogy(1)
Reminder : gPad always points to the current
pad.
IX.2.3 Using
configuration files produced by the standalone dataDisplay
application
The standalone Data Display application
produces configuration files ("cards files") that a user may wish to reuse. This
may be done if a cards file points to files (not to online Cm producer) by
starting the data display interactively with the
dataDisplay()
command and then loading the cards file from the Config Menu :