The examples are available interactively in
the VEGA site : tutorials.
We suppose you have created the demo frame files by executing the macros
"create_testfr.C" and the corresponding local metadatabase with "create_DB.C"
(this is just a two lines script that does what is described above for creating
a database).
XII.1 Example
1 : Displaying a peak
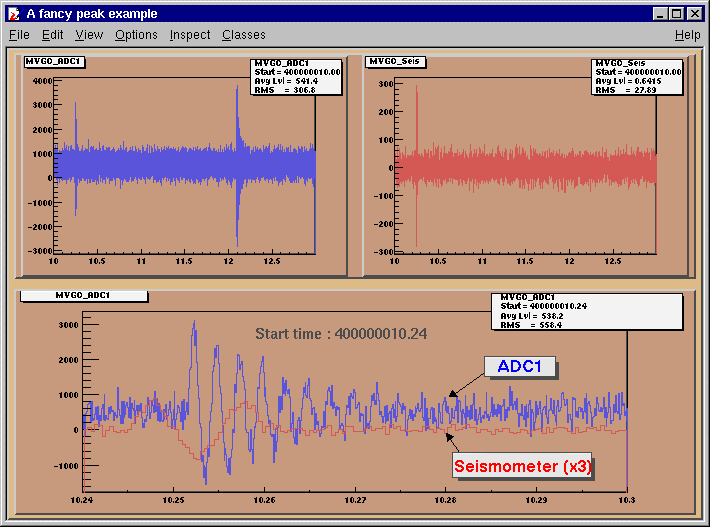
The first example is showing how one can
display a potentially interesting peak, zooming in and plotting two channels on
top of each other (macro
peak.C)
:
{ //
This example shows how to plot a region of
interest. // To see
the result of this macro, click here
// The access of
data is made by its
time. // A much
fancier example is given in here
gROOT->Reset();
// Open a new window (canvas)
c1 = new TCanvas("c1","A
peak
example",1);
//
===== Creates the needed pads by dividing the initial canvas
=====
c1->Divide(2,2); // ===== Opens the
frame channel =====
vd =
new
VFrameChannel("demoDB.root");
//
===== Gets the needed vectors and draws them
===== // ===== First
the upper plots
=====
c1->cd(1);
// select the first
pad
gVM->Draw(frv1);
c1->cd(2);
// select the second
pad
gVM->Draw(frvSeis); //
===== Gets the needed vectors and draws them
===== // =====
Second the same plots superimposed
=====
// Gets
the needed vectors again but zooming on the region of
interest frv2 =
vd->GetVect("adc.MYGO_ADC1",400000010.24,0.06);
frvSeis2 =
vd->GetVect("adc.MYGO_Seis",400000010.24,0.06); // Draws them in
the second pad, superimposed on top of each
other
c1->cd(3);
gVM->Draw(frv2);
gVM->Draw(frvSeis2,"same"); }
To show the result when displaying a the
same peak but in a very fancy way (well, this is all a matter of taste...), with
the macro "peak2.C", here is the result :
Example
2 : scrolling data
This example shows how to display a channel
extracted from a database with scrolling one second at a time. The channel is
extracted in the form of FrVect vectors. Each extracted FrVect does not match
the length of the frame it belongs to. In fact, the user should not care about
that.
The example is in the file
scroll.C { //
This simple example opens a demo local database and plots a
vector. // The
vector is scrolled 1 s at a time, nvecmax
times. // The
extraction of the vector shows that one can select a
vector // without
having to think about the frame
boundaries. // The
length of the vector is arbitrary and is only limited by the
available // amount
of memory.
gROOT->Reset();
FrVect*
frv; Double_t
time;
// Max
number of vectors displayed
Int_t nvecmax =
20; // Time step of
the scroll Double_t tistep =
1; // Length of the
displayed vector Double_t
veclength =
4;
// Open a new
window (canvas) c1 = new
TCanvas("c1","c1",1); // Open a frame
channel vd = new
VFrameChannel("demoDB.root");
//
Start time time =
400000000.1;
//
Get the first vector frv =
vd->GetVect("adc.MYGO_ADC1",time,veclength);
Int_t nvec = 0; while (
(frv!=0) && (nvec<nvecmax) )
{
nvec++; printf("nvect = %d,
time =
%fn",nvec,time);
//
Draws the vector
gVM->Draw(frv); //
Update the canvas
gPad->Update();
FrVectFree(frv);
time
+= tistep; frv =
vd->GetVect("adc.MYGO_ADC1",time,veclength);
// Get the next
vector
} }
XII.3 Example
3 : histogramming some data and fitting the result
This example shows how to use histogramming
with the VManager. Access is made to the data and an interesting part containing
a peak is displayed, as well as a histogram of the data. The histogramed data is
accumulated over several frames and, at the last frame, a fit is made to the
histogram. One fits a gaussian to show the deviation from
gaussianity.
The example is in the macro
scroll2.C
{ //
This example plots a vector and accumulates a histogram of the
values // of this
vector. // Only the
part of the vector that corresponds to the interesting
part // are plotted
(a peak at the beginning of the
frames) // The
histogram is accumulated for nframmax
frames // To see the
result of this macro, click here
gROOT->Reset();
FrameH* fr;
Double_t
time;
//
Max number of frames displayed
Int_t nframmax =
14;
//
Open a new window (canvas) and divide it by 2
c1 = new
TCanvas("c1","c1",1);
c1->Divide(2,1);
c1_1->SetFillColor(44);
c1_1->SetFrameFillColor(41);
c1_2->SetFillColor(44);
c1_2->SetFrameFillColor(41);
c1_2->SetLogy();
c1_2->SetGridx();
c1_2->SetGridy();
//
Open a frame channel
vd = new
VFrameChannel("demoDB.root");
//
Start time
time =
400000000.1;
//
Histogram to constrain the limits
hisfr = new TH1F("hisfr","Histogram of
MYGO_Seis values",100,0.,3000.);
hisfr->SetMarkerColor(4);
hisfr->SetMarkerStyle(8);
hisfr->SetMarkerSize(0.7);
//
Get the first frame
fr = vd->GetFrame(time);
Int_t nfram = 0;
while ( (fr!=0) &&
(nfram<nframmax) ) {
nfram++;
printf("nfram =
%dn",nfram);
//
Draws the vector (only in the signal region)
c1->cd(1);
gVM->Draw(fr,"adc.MYGO_ADC1",0.13,0.07);
//
Get the corresponding VSPlot and set the color to blue
VSPlot* vfp =
gVM->GetLastPlot();
vfp->SetLineColor(4);
//
Fill the histogram (accumulates it) and draw
it // the +
option in front of the name of the
histogram //
means that it's content is not erased before each fill
XII.4 Example
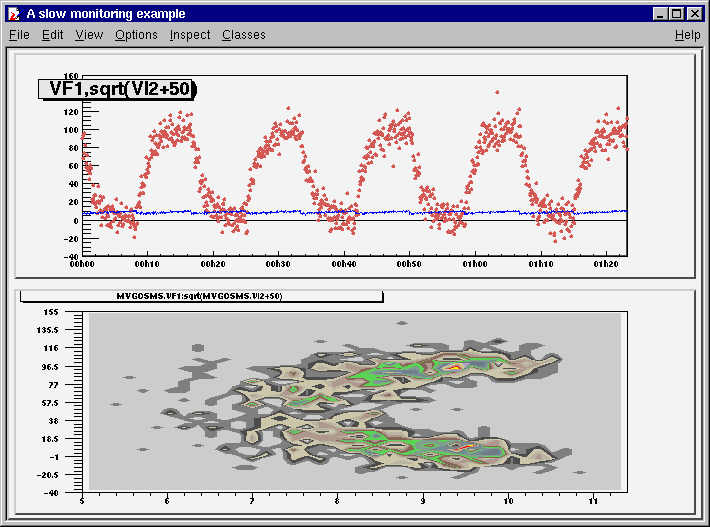
4 : Extracting some slow monitoring data and doing some simple plots
This example shows how to extract slow
monitoring data and plot variables or combinations of them.
The example is in the macro
sms.C { //
This example shows how to plot a set of slow monitoring
values. // To see
the result of this macro, click begin_html <a
href="gif/sms.gif">here</a>
end_html // A ntuple
is build and used to plot various combinations of
variables.
gROOT->Reset();
//
Open a new window (canvas)
c1 = new TCanvas("c1","A
slow monitoring
example",1);
//
===== Creates the needed pads by dividing the initial canvas
=====
c1->Divide(1,2); // ===== Opens the
frame channel =====
vdsms
= new
VFrameChannel("SMSdemoDB.root");
//
===== First builds the ntuple from the MYGOSMS station values
=====
nt =
vdsms->ExtractSMS("nt","MYGOSMS",400000000,5000);
//
===== Then draws the plots
=====
c1->cd(1);
//select the first
pad
// Sets
some style options
gStyle->SetMarkerColor(50);
gStyle->SetMarkerStyle(8);
gStyle->SetMarkerSize(0.5);
// Draws the value VF1 with respect to time
// t is
automatically filled as the first variable of the ntuple at
extraction
nt->DrawSeries("MYGOSMS.VF1","","P");
vs = gVM->GetLastPlot();
vs->SetTitle(""); // Sets some
style options
gStyle->SetLineColor(4);
// Superimposes the values of sqrt(VI2+50) (it's an
example)
nt->DrawSeries("sqrt(MYGOSMS.VI2+50)","","same"); // Draws a title
for the graphs pl = new
TPaveLabel(-400,135,1000,156,"VF1,sqrt(VI2+50)","br");
pl->Draw(); // ===== In the
second pad, draws a histogram
===== // ===== of
values VF1 with respect to sqrt(VI2+50)
=====
c1->cd(2);
// select the second
pad // Draws the
histogram
nt->Draw("MYGOSMS.VF1:sqrt(MYGOSMS.VI2+50)","","cont0"); }
Here is the result of this macro
:
XII.5 Example
5 : Extracting a vector and plotting spectra
This example shows how to use the fft
algorithms to plot spectra.
The example is in the macro
scrollspectrum.C
{ //
This simple example opens a demo
metadatabase, //
plots a vector and it's
spectrum. // The
vector is scrolled 1 s at a time, nvecmax
times. // The
extraction of the vector shows that one can select a
vector // without
having to think about the frame
boundaries. // The
length of the vector is arbitrary and is only limited by the
available // amount
of memory. // It is
also shown how to use the FFT from the signal analysis
library
gROOT->Reset();
gBenchmark->Start("scrollspectrum");
FrVect*
frv; // Max number of
vectors displayed
Int_t nvecmax =
20; // Time step of
the scroll
Double_t tistep =
1; // Length of the
displayed vector
Double_t veclength =
4; // Start
time
Double_t time =
400000000.1; // Open a
new window (canvas) and split it
c1 = new
TCanvas("c1","c1",1);
c1->Divide(1,2);
c1->cd(2); // Open a
frame channel
vd = new
VFrameChannel("demoDB.root"); //
Get the first vector